
Building Dashboards in SAP Analytics Cloud: Models, Stories and Filters
June 26, 2019

Many organizations struggle to turn their transactional data into insights that support better decisions. This paper shows how SAP Analytics Cloud (SAC) brings data from SAP and other sources together into simple, interactive dashboards that business users can explore themselves.
Key Takeaways
- SAC is a cloud solution that connects to your current data sources, from ECC, S/4HANA, BW and BPC to SuccessFactors, Salesforce and Google Drive
- A model holds the data you report on; a story, built on a model, is your dashboard
- Drill-down and Top N / Bottom N charts show why numbers are higher or lower than expected
- Global filters, such as a date range or product list, update every chart in a story at once
- Smart Insight uses machine learning to build a story and explain what is driving your results
Summary
SAP Analytics Cloud can be used to create dashboards even from complex and disparate data feeds. It provides self-service business intelligence that is visually appealing and simple to understand and use. This paper explains how to use SAC to create a dashboard tailored to your specific needs.
Solution Overview
SAP Analytics Cloud is a cloud-based solution that integrates with your current data sources and brings them together into a simpler, more dynamic analytical landscape. Its key features include:
- Analytic model creation
- Story creation
- Data exploration
- Simple machine learning capabilities with Smart Discovery and Smart Insight
- Collaboration
- A responsive user interface for viewing reports on smartphones, tablets or desktops
- Pre-built templates that make it easier to develop your own content
What Is a Model?
A model in SAC holds the data you want to report on. The simplest model can be built from a CSV file saved locally. Alternatively, a data connection can extract and load data from an on-premise source such as ECC, S/4HANA, BW or BPC, or from cloud sources such as SuccessFactors, Salesforce or Google Drive. Models are the foundation on which stories are built.
What Is a Story?
A story in SAC is where you create your reports and visualizations, and each story is linked to a model. In a story you explore the data, choose the data points you want to report on and build visualizations such as charts, line graphs, tables and geo maps that give executives and senior management better insight into their business. A story is your dashboard.
Drill-Down and Top N / Bottom N Analysis
Charts can drill down into subsections of a data member, so users can easily see why specific numbers are larger or smaller than expected. In the paper's example, a chart of average gross margin by state (California, Nevada and Oregon) drills down from California into its individual cities.
SAC also has a pre-built function to build a chart from the top or bottom numerical results. You choose how many to show, such as the top or bottom 5, 10 or 20. The paper's example shows the top 5 and bottom 5 California cities by average gross margin.
Global Data Filters
SAC can set global filters in a story. For example, a date range filter and a product drop-down list can update all visualizations in the story at once, making the story more interactive. In the paper's example, users narrow a 2014-2017 date range and pick product categories, such as alcohol, carbonated drinks and juices, down to individual products.
Smart Insight and Geo Maps
Smart Insight uses SAC's machine learning capabilities to create a story automatically from the data in your model. It generates business insights that help you understand why specific business segments, locations or products are outperforming or falling short of previous expectations.
Geo maps give a visual sense of geographical data, based on any measures you find relevant.
Sample Dashboard: Why Is Nevada's Revenue Low?
The paper ends with a sample story page that explores two possible factors behind Nevada's low revenue: discount percentage and marketing events per state. It combines a geo map of revenue by city, a chart of net revenue against the number of events by city, a chart comparing discount percentage with net revenue for California, Nevada and Oregon, and a chart of marketing types per state. Its conclusion: the high level of discounts in Nevada and Oregon is leading to lower net revenue.
How CONTAX Can Help
CONTAX helps SAP customers build dashboards and reporting tailored to their needs. Learn more about SAP Business Intelligence or contact us.
Related Articles
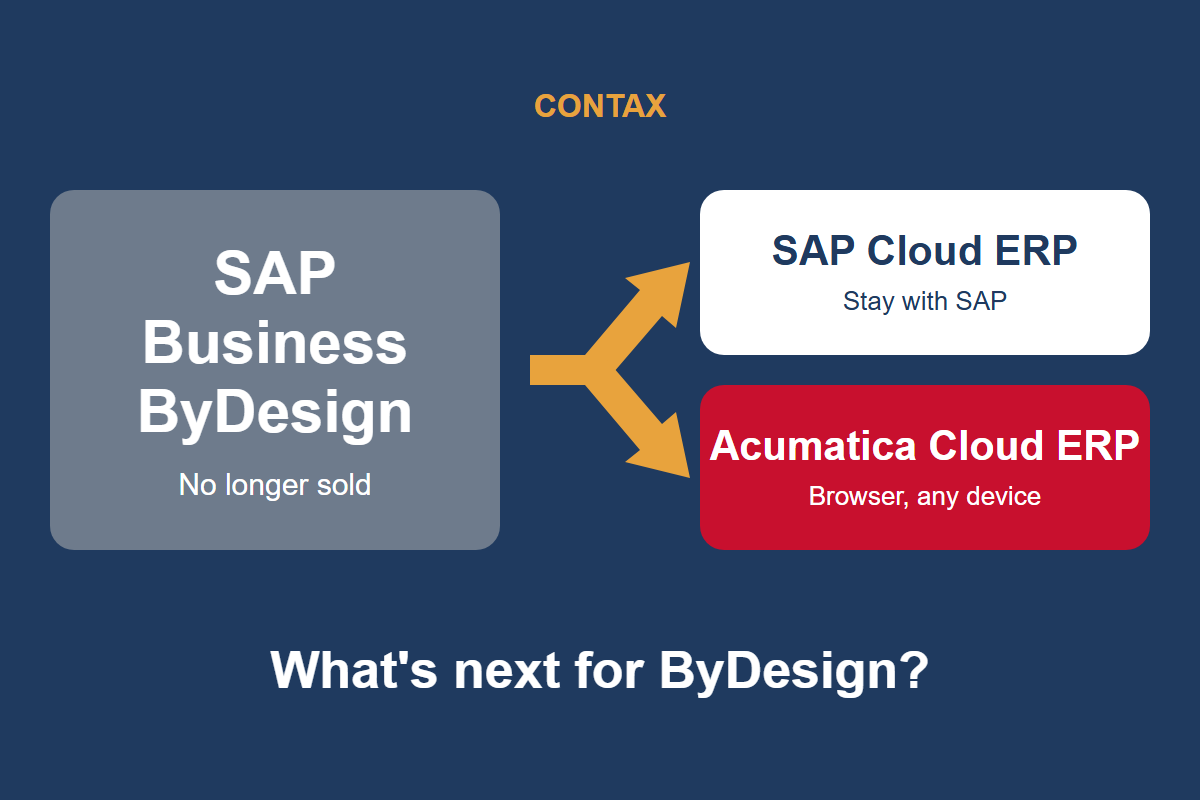
What's Next for SAP Business ByDesign Customers?
SAP has stopped selling Business ByDesign to new customers. Here's what that means if you run it today, and your options for what comes next.
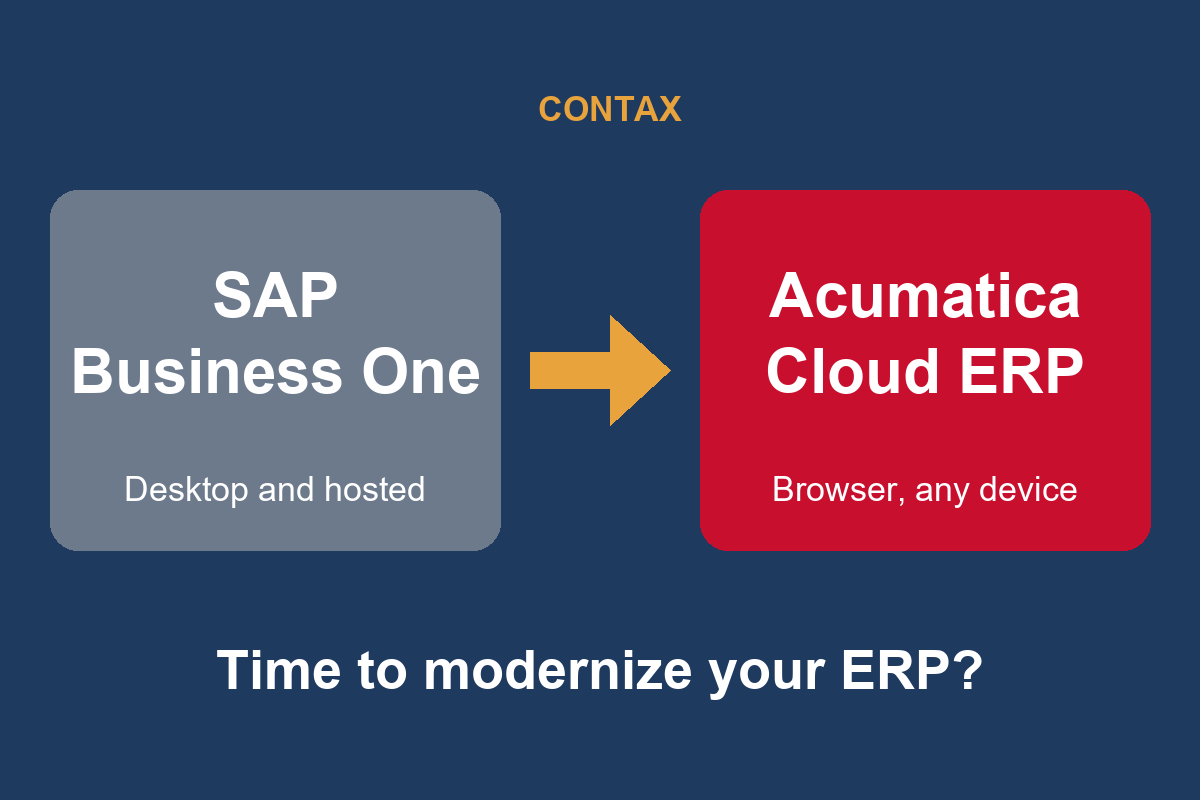
Why SAP Business One Customers Should Consider Moving to Acumatica
SAP Business One has served growing companies well for years. Here's why Acumatica Cloud ERP is worth a look as you plan your next ERP decision.

Wayne Safety Upgrades Operations and Warehouse with Acumatica and CONTAX
Wayne Safety replaced its 30-year-old DOS-based ERP with Acumatica Cloud ERP, implemented by CONTAX, and went live a month early with 35%+ better order management and a 5-day faster close.